In order to improve the functionality of the automotive safety system and driver assistance technology, Linepro developed force sensing resistors or FSR for automobile or cars or vehicles to help make judgments about the seat conditions inside a vehicle. We use FSRs to determine the body structure of the occupant and whether there exists a child restraint system. Modern vehicles are equipped with airbags, which when deployed cause injuries to occupants. Sensors that can detect the body, posture and build of occupants are essential in India where the number of vehicle accidents every year is about 5 lakhs. We at Linepro have developed a flexible force sensing resistor or sensor to measure load distributions for car seat occupants. Additionally, we investigated a method of classifying the occupants based on body build.
We have tested the accuracy of a method to determine the standing height of occupants using peak distance and buttock width, as indicated by the load on the seat. It has been found that this method can discriminate between children and adults with an accuracy of around 90%.
Purpose behind using Force sensing resistor for passenger safety
In order to improve automobile safety, supplemental restraint systems (SRS), also known as airbag systems, have been widely used in recent years. A variety of technologies, including force limitation and seat-belt pre-tensioning, are being implemented. However, air bags are also linked to fatalities all over the world. Governments all over the world called for the development of a safer bag that is less likely to cause injury. Air bag deployment should be controlled by factors such as the severity and seating configuration (e.g., whether a child restraint system has been installed), the build, posture, and seat position of the occupants, etc. Force Sensing resistors are required to determine these. There are many sensing methods, including infrared, electric field, and others. Their advantages and disadvantages have been identified.
We have therefore developed a flexible force sensing resistor that can be used in an in-vehicle setting. We are also investigating the possibility of a system that uses data on seat load distribution to make judgments about body build, etc.
Determining occupant’s build using force sensing resistor
Flexible force sensing resistors or sensor can be used in electronic keyboard instruments as well as medical instrumentation applications. They are similar in design to membrane keypads in computer keyboards. The difference is that, whereas a membrane keypad only has two positions–on or off–the flexible force sensing resistor or sensor has electrodes made of pressure sensitive ink. This allows the electrical resistance between the electrodes to change continuously according to the pressure applied. Flexible force sensors, which can be set up by screen printing in many different patterns, can be fitted in existing car seats without any structural modifications. These sensors are so thin and flexible that they can be installed between the urethane foam and the cover so as the flexible force sensing resistors are not visible to the occupant.
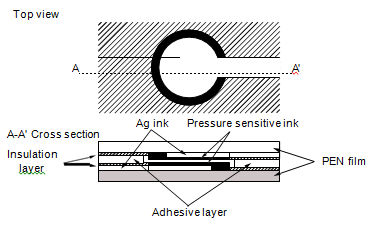
The in-vehicle flexible sensor developed by Linepro uses a polyester base film. Figure 1 shows a cross section and top view of a pressure-sensitive point. The electrodes at pressure-sensitive points measure approximately 10 mm in size and have an overall thickness of 0.2 mm. To prevent silver from migrating, an insulating coating is printed on top of the silver ink circuitry. An air gap is created between the electrodes at pressure-sensitive points. This allows the minimum pressure necessary to activate the flexible force sensing resistor to change as the air in the gap expands and contracts with temperature. As in the case with a membrane switch, an air outlet is also provided (not shown).
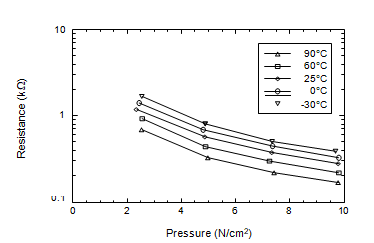
Figure 2 illustrates that there is an inversely proportional relationship between the resistance of the flexible sensors and pressure applied. It is also dependent on atmospheric temperature. The composition of the pressure sensitive ink, thickness and type of base film as well as the structure (electrode space and gap) of each sensor cell determine the sensitivities. Temperature dependence can be explained by the fact that the stiffness and thickness of the pressure-sensitive ink and base film changes with temperature.
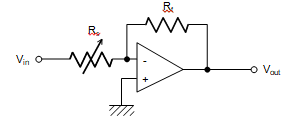
The inverting amplifier circuit in an operational amplifier is used to read out changes in resistance. (see Figure 3). Rs indicate the resistance of the pressure sensitive point. The resistance of this point is proportional to the pressure applied to it (Equation 1) and the output voltage Vout from the operational amplifier is proportional to the pressure P applied at the pressure sensitive point.
Let’s now consider how the flexible force sensing resistor sensor is used to determine the body composition of the occupant.
First, we will use the traditional method of judging body weight based on seat cushion load. This is to establish a correlation with the seating posture- this is because the backrest angle variation causes change in the load on the seat cushions. The problem with children is that their feet are not touching the ground, but adults have their feet on the floor. Therefore, estimating body weight from the cushion’s load can be prone to error. Other problems with measuring load with a flexible force sensing resistor is the temperature dependence of the sensor, the temperature and humidity effects the stiffness and durability of the urethane foam used to make the seat cushions, and the foam’s deterioration over the years.
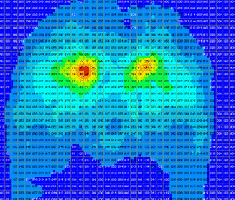
A flexible force sensing resistor mat, consisting of many pressure-sensitive points is placed between the seat cover and the urethane foam, the relationship between load distribution data and body parameters and pressure measurements was then measured. Figure 4 shows the typical load distribution to the seat cushion during a person’s sitting position. The twin pressure peaks are located below the buttocks. Our investigations by R&D team have reported that these pressure peaks are below the ischial tuberosity. We have established no correlation between the peak value (which is a measure
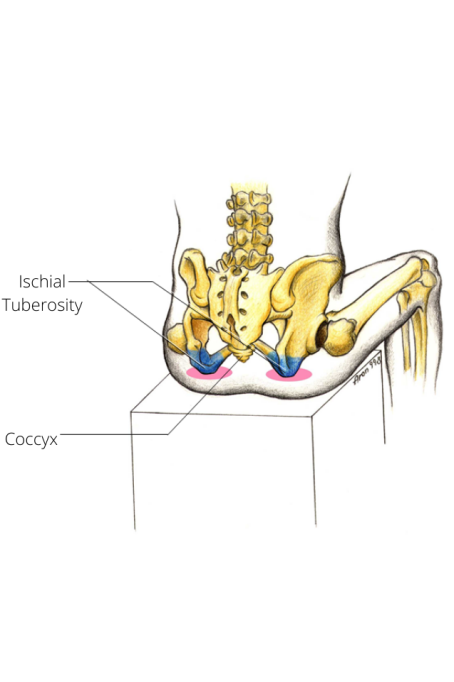
of standing body height, body mass, body weight, degree or circumference of the thighs) and the Rohrer Index (which measures body weight, standing body height, body fat, degree, adiposity, or maximum thigh circumference). The reason for this is that the shape of the ischial tuberosity becomes more tapered towards the tip. This means that the area in contact with the seat surface and the pelvis, causes changes in peak value depending on the angle between them. It is difficult to calculate the body weight of an occupant based on the peak values.
Let us now turn to the relationship between skeletal structure and body parameters. It is reported that standing body height can be estimated by measuring the length of the vertebral column. There are many gender differences and individual variations. It is well-known that the relationship between body size and buttock size is related to body build parameters.
We therefore investigated the relationship between two characteristic peaks below the ischial tuberosity (hereinafter referred as the “peak distance”), the standing body height and the occupant’s body weight. These parameters are used to calculate the standing height and weight of occupants.
The pitch between pressure-sensitive points can be reduced to provide more information on load distribution. However, this will require an expanded interface circuitry between flexible force sensing resistor and the signal processor, making it too bulky and costly for in-vehicle usage.
In Figure 4, it then spreads out to the left and right. The figure shows the data for pressure-sensitive points. Solid lines are the approximations of approximation curves.
We attempted to reorganize this relationship between these approximation curvatures and the parameters for body build. In other words, we took the distance between two peak positions on the approximation graphs as the peak distance, and the distance between lower reaches of peaks that extend out to left or right as the buttock prints width. This relationship is between standing body height, body weight.
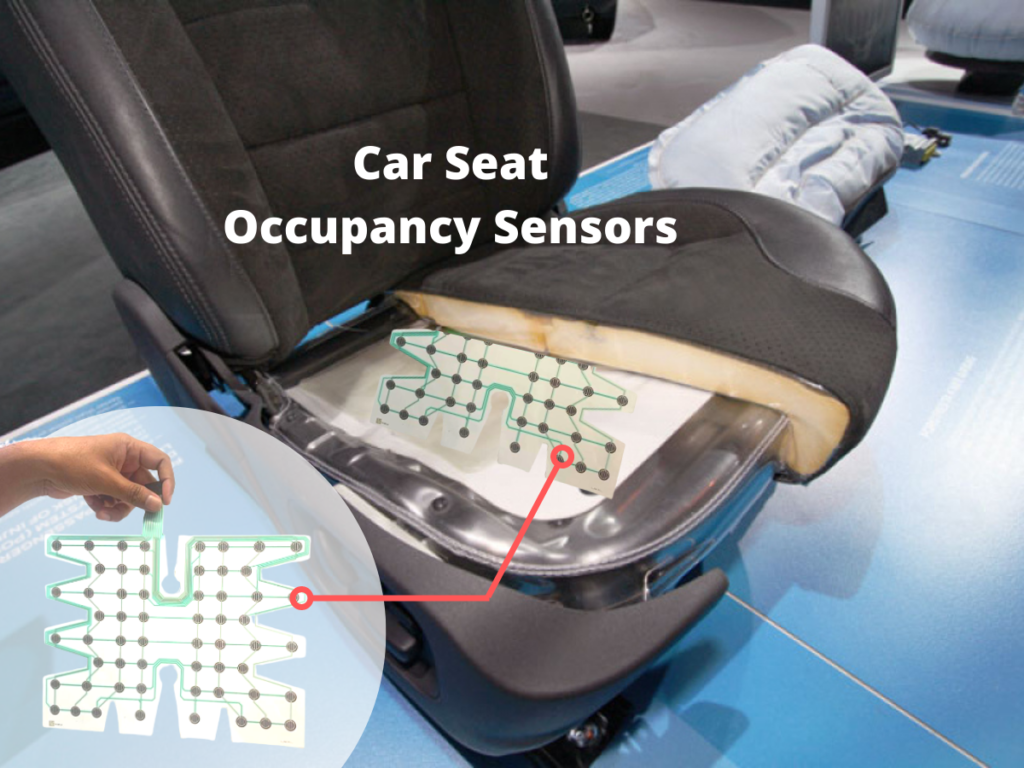
The purpose was to determine if there is a relationship between body size and buttock size. The flexible force sensing resistor mat was composed of 64 pressure-sensitive points and was placed in an 8×8 matrix with a pitch of 2.5 cm front to back and 3 cm left to right in a compact sedan. It was located in the area where the buttock would be when the occupant was seated. (See Photo 1).
When a seat is equipped with an array of Force Sensing Resistors withpassengers occupying the car, allows for load distribution measurements. Before the subjects got into the test car, they were measured for their standing height and weight.
The relationship between peak distance and standing body height
As the peak distance increased, so did the subjects’ heights. The adults also showed a gender-based variation. The data was obtained using a recursive straight line. It was discovered that the standard deviation between the actual and estimated height was 11.6 cm.
The relationship between body weight and buttock width
As the buttock width increases, so does the body weight. As for height, the adults showed a gender-based variation in weight. The data were recursively straight-lined and it was discovered that the standard deviation between the actual and estimated body weight was 9.5 kg.
Final Outcome
The results indicated that children could be distinguished from adults by using dummies the same size or smaller as the 6-year-old dummy, as well as those with a larger body than the lighter-build female dummy. This accuracy can be attributed to the use of peak distance or buttock prints width algorithms.
Child restraint systems are now very necessary. It is important to classify the passenger seat occupant in order to determine if a child restraint system has been installed. Manufacturers recommend that child restraint systems be installed in the rear seat of cars with front passenger air bags. However, it is possible for motorists to install them in the front.
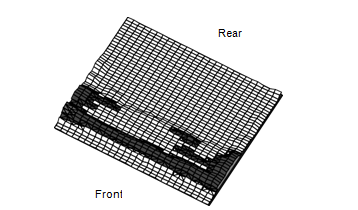
Figure 5 illustrates the load distribution after a child restraint is installed. The load distribution is significantly different when the person is sitting. Therefore, we tested whether it was possible for a person to distinguish between a child restraint and another object in the seat. The test equipment collected load distribution data when the seat was being used by a child restraint, sandbag, or briefcase. The data was combined with data on human occupants (see the previous section) were used as learning data to build a neural network. The neural network was then fed the rest of the data and the results were obtained. It was found that the accuracy of this system developed by Linepro was around 90%. However, there are a few things to consider when using the neural network’s learning function.
One is that judgment accuracy varies depending on how data used as learning data are defined. Given the number of child restraint systems currently available, it is difficult to create a neural network that covers all of them. Furthermore, new types of child restraint system will be introduced to the market and it is likely that neural networks that are limited to older models will make errors. This will mean that motorists won’t be able use the new systems. Although we have reviewed other judgment methods that incorporate pattern learning and fuzzy rules, our preference is for the algorithm that distinguishes between people and objects based on the relationship between pressure peaks and load data.
Conclusion:
Linepro has created a flexible force sensing resistor that can be used in an in-vehicle environment and have devised a method to determine the seat’s body structure.
Based on data from the sensor about load distribution, the occupant is determined. The method of judgment was used to classify occupants in two classes, child or adult. It was estimated that the accuracy of this classification could reach 90%.
We will use a prototype that incorporates an algorithm to classify occupants based on body build, and an algorithm to distinguish child restraint systems or other objects. This will allow us to test the effects of occupant’s posture, and the determination of child restraint systems or other objects being placed on the seat. In this way, we can clarify practical problems. For any consultation on Force Sensing Resistors or Force Sensors or to develop a unique customized system drop your contact with us and we will get back to you.